|
Nitya Nigam Although there are many things we don’t know about COVID-19, there is one thing we do know: the pandemic will only end once enough people are immune to the virus, causing its spread to slow and eventually stop. At this point, whether immunity is obtained through people being infected or vaccinated, the population will have developed “herd immunity”. This threshold is an important figure to consider, since it informs decisions about how many vaccines need to be produced and when places can lift lockdowns and reopen. However, calculating this threshold is a complex process. To understand how we get to the herd immunity threshold, we need to derive an equation. If you’ve been reading about COVID-19, or know about the spread of disease, you should be familiar with the term R0, which refers to the average number of people infected by one infected person. R0 acts as a measure of how quickly a disease can spread. If R0 is 1, then the spread of infection follows a linear track - each infected person infects one more, who can only infect one other person, and so on. However, if R0 is larger than 1, the spread quickly becomes exponential. If R0 is 2, then the first patient can infect two other people, who can each infect two more causing 4 infections, then 8, then 16 and so forth. Therefore, our goal with herd immunity is to bring the number of people infected by a single patient down to 1, or even less. Say you are infected with COVID-19, and have a population of 10 people that you interact with. If we set R0 to be 2, then two of the 10 people get infected. This means that the chance of somebody getting infected is 20%. However, if five of your friends are vaccinated or have already had COVID-19, they would be immune to the disease. This means that there are only five remaining friends who could fall sick. The same probability of 20% applies to them, so only 0.2*5 = 1 of them will be infected. We can generalise this process for any value of R0. If we assume that each infected person comes into contact with N people in each time period (usually a day), then we can expect R0/N people to be infected on average. If there are immune people in the population (we can call this number I), then the number of new infections can be represented by the following expression:  We want this to equal 1, so we have the equation: 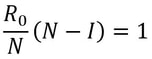 We want to solve this for I/N, which represents the proportion of the population that needs to be immune. Rearranging for this gives  So our formula for the herd immunity threshold is just 1-(1/R0).  However, finding an R0 value is more difficult than it may seem. R0 values can vary hugely by location - urban areas can have R0 values more than twice as high as country averages. There are also biological differences between people that can make them more likely to get infected. These biological variations, which are results of both genetic makeup and environmental factors, are referred to by epidemiologists as the “heterogeneity of susceptibility”. For example, R0 values would be much higher in places like nursing homes, where elderly people are far likelier to fall ill. On a broad scale though, heterogeneity tends to lower the herd immunity threshold. At first, the virus will spread to people who are more susceptible, but once most of these susceptible individuals are infected, the spread of the virus will slow.
There is disagreement in the scientific community regarding what the herd immunity threshold for COVID-19 really is. Standard models indicate that 60% of the US population would need to be vaccinated for herd immunity to be achieved, but some experts place the value between 40% and 50%. Another (non-peer-reviewed) study done in May suggests that the value could be as low as 20%. While the scientists debate, however, the best thing to do is prevent the spread of the virus and decrease the R0 value as far as possible. Social distancing, mask-wearing and widespread testing are our best bets to keep people safe and healthy until vaccines are widely available.
0 Comments
Nitya Nigam The global COVID-19 pandemic continues to rage on, with the total number of cases around the world having just hit 13 million. In addition to mask-wearing and social distancing, scientists have highlighted widespread testing as an important measure in reducing the spread of the coronavirus. However, many regions do not have sufficient equipment and chemicals to run individualised tests. For this reason, the mathematical strategy of group testing has been suggested as a way to quickly test a large number of patients without using up an excess of precious testing materials. Group testing involves mixing samples of several people together, and then testing the mixture in one go. If this test comes back negative, then all of the people whose samples went into the mixture are marked as negative at once, saving time and resources. However, if this test comes back positive, further testing is required to pinpoint the infected individuals. There are four main techniques to do this. 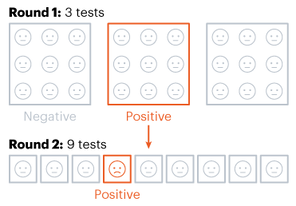 Method 1 involves samples being mixed together in groups of equal sizes, and then these mixtures are tested separately. If a group tests positive, then each individual member of the group is retested. This method was used in Wuhan, China in May, as part of efforts to test the majority of the city's population, identifying 56 infected people from about 2.3 million individuals involved in testing. This method works best in low levels of infection (about 1% of the population), because group tests are likely to be negative. 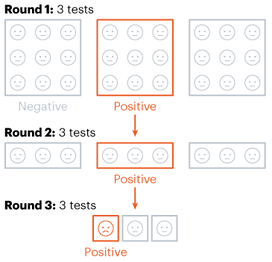 Method 2 is a more sophisticated version of Method 1, which adds more rounds of group tests before testing individuals separately. However, both of these approaches are quite slow, as it takes several hours to get the results for each group test. These group results must be known before further testing can occur to pinpoint individual infections. “This is a fast-growing, fast-spreading disease. We need answers much faster than this approach would allow,” says Wilfred Ndifon, a theoretical biologist based in Rwanda. 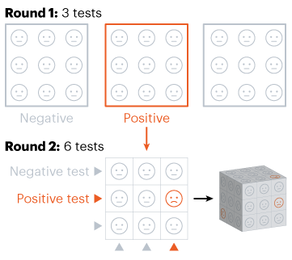 Ndifon and his colleagues at the African Institute for Mathematical Sciences have improved on these strategies, aiming to reduce the number of tests needed. Their first round of group tests is the same as described above, but for positive-testing groups, they propose a different method. Imagine a 3x3 grid, where each cell represents one person’s sample. The samples in each row and column are tested as one group, meaning there will be 6 total tests, and each individual will have been tested twice. If an individual sample is positive, it will cause both groups it is part of to be positive, making it easy to find the individual. The dimensionality of testing can be increased from a square grid to a cube, which allows for bigger groups and higher efficiency. This constitutes Method 3. 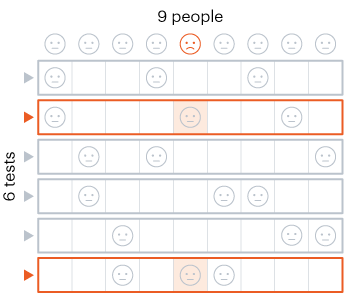 Although Method 3 decreases the number of tests that must be conducted, some scientists say that even two rounds of testing take too much time. Manoj Gopalkrishnan, a computer scientist at the Indian Institute of Technology Bombay, has proposed a one-step solution that is our Method 4. His approach involves mixing samples in different groups, using a counting technique known as Kirkman triples, to determine how the samples should be distributed. Imagine a grid in which each row represents one test, and each column represents one person. In general, each test should have the same number of samples, and each individual’s sample should be tested the same number of times. This method requires more tests to achieve the same level of accuracy as the previous methods and also means working with a large number of samples at once. However, it significantly decreases the amount of time taken to test a large group of people.
Let us know in the comments if you enjoyed this article, and what your thoughts on group testing are! Fresh Pisuttisarun Ever since the COVID-19 pandemic began, people have been skeptical about the numbers of cases being reported around the world. Many have claimed, although with little supporting evidence, that health officials are tampering with the numbers, in order to avert public fearmongering, economic decline, and international shame. As an ordinary person without access to global healthcare databases or CIA-level intelligence, it seems impossible to investigate this. However, an extraordinary law of mathematics gives us some fascinating insights into the situation! Benford’s Law states that real-world data follows a special pattern in which the leading digits of individual pieces of data appear in descending frequency from 1 to 9. Let’s take the population of countries as an example. The number of countries whose population starts with a 1 — China (1.4 billion), Mexico (130 million), Greece (10 million), Tonga (110,000), etc. — is higher than the number of countries with a population that starts with a 2. The pattern continues: 2 appears more frequently than 3, 3 appears more frequently than 4, and so on. This law can be extrapolated to all sorts of real-world data. Areas of countries, heights of skyscrapers, genome data, and macroeconomic spending are all known to obey Benford’s Law. In fact, the law is so powerful that it is even used to detect fraud in election results and credit card transactions! So how can this be applied to the COVID-19 numbers? Well, the number of national COVID-19 cases, being real-world data, is expected to obey Benford’s Law. If it doesn’t, that could suggest widespread fraudulent health reports. 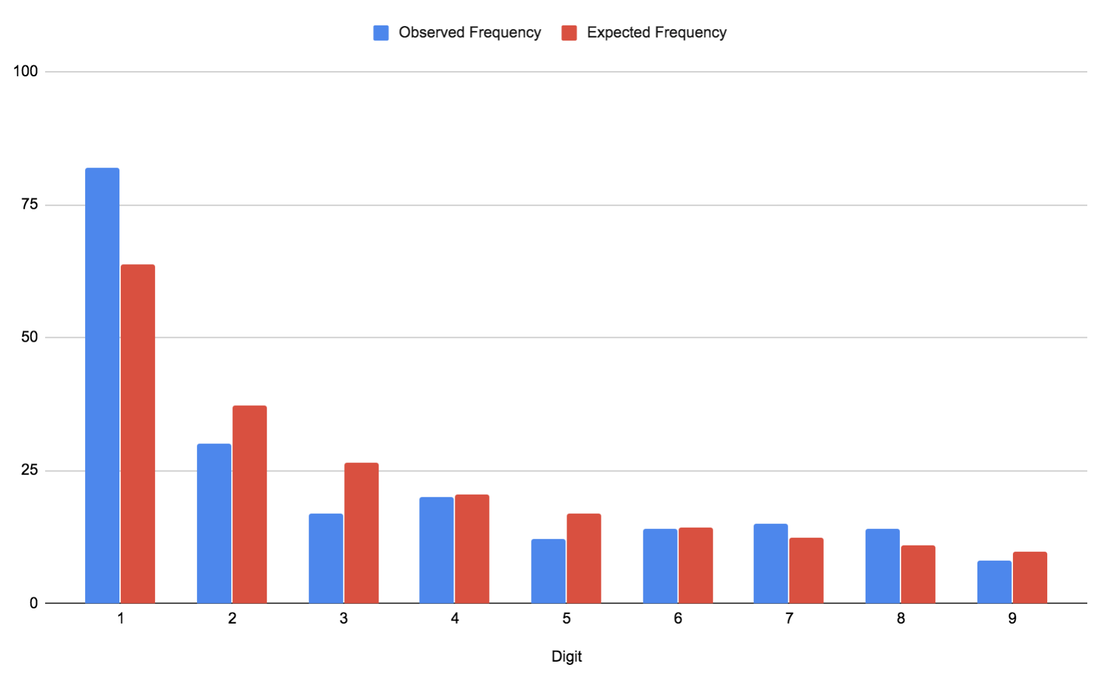 The blue bars in the graph shows how frequently each digit appears as the leading digit of COVID-19 cases in a country. The red bars show the frequency that would be expected if this data set perfectly obeyed Benford’s Law. Visibly, this seems like a good fit; the differences seem small enough to be accounted for by natural randomness. To mathematically confirm this impression, a chi-squared test can be used to test for goodness of fit. This statistical test takes into account the differences between the observed and expected values (the difference in height between the blue and red bars) to determine whether Benford’s Law is a good enough fit for our observed data set.
Turns out... yes! Benford’s Law is a great fit for the data set at a 1% significance level, which seems to suggest that the number of COVID-19 cases retains real-world veracity. However, this does not mean that the numbers have not been tampered with at all. There could be dishonest numbers in the set, but these do not become noticeable. It only means that the health officials around the globe are generally being honest. We can rest assured that most countries are not reporting randomly made-up numbers! But why does Benford’s Law work? Given that the number of COVID-19 cases in a given country is totally random, shouldn’t that flatten the curve (pun intended) into a uniform distribution? This part of the law is harder to grasp, so hold tight. Imagine you are a country during the COVID-19 pandemic. The number of COVID-19 cases in your country is not randomly generated by a computer — it’s accumulated. You first start off with 0 cases, then as the disease spreads, the number goes up, one-by-one, from 0 to 1 to 2 to 3, etc. When you count, you always count 1 before 2, 2 before 3, 3 before 4, etc. You count the 10s before the 20s, the 20s before the 30s, etc. You count the 100s before the 200s, the 200s before the 300s, etc. Therefore, if I were to ask what number you’re on at any given moment, you are more likely to be on a number that starts with 1 than 2, 2 than 3, 3 than 4, etc. The number of COVID-19 cases is no different: the cases accumulate. Every country with 2 cases must have had 1 case at some point before; a country with 5,000 cases must have had 3,000 cases at some point before; a country with 900,000 cases must have had 600,000 cases at some point before, and so on. Therefore, if we stop the world and ask all the countries for their number of cases, as long as the health officials are honestly counting and not randomly generating numbers, the results should obey Benford’s Law. If you're interested in other applications of Benford's Law, check out this article which outlines how it can be used to help you do well on multiple choice tests! |